
Key Takeaways
●Gain a greater understanding of the FMEA process.
●Develop a greater understanding of the FTA process.
●Understand how to discern which process best fits your company’s needs.
Understand failure mode and effects analysis (FMEA) vs. fault tree analysis (FTA) to choose the right method for your company.
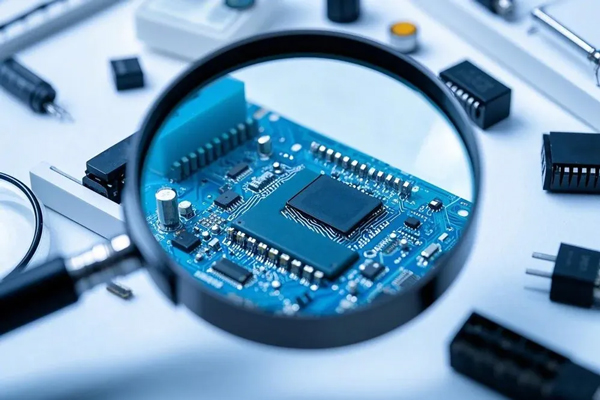
Whether you work in the field of electronics, PCB design, PCB manufacturing or PCB assembly, you must be able to mitigate the risk of product failure. The use of failure mode and effects analysis (FMEA) is a vital and necessary tool in the overall reduction of the risk of system failures in your products.
However, there is another tool that is equally important in the assessment and mitigation of the risks associated with system failures. This particular tool is called a fault tree analysis (FTA). Over the next few paragraphs, we will do a critical and comparative analysis of FMEA vs. FTA to determine their differences as well as their respective approaches to risk assessment.
What Is FMEA and How Can it Limit the Risk of System Failures?
FMEA is a method used to pinpoint where specific systems or machinery may fail. The obvious benefit of this assessment is the fact that it affords a company the ability to be proactive. Having the ability to review your components and subsystems, while simultaneously identifying potential system failure modes, is an invaluable tool.
FMEA’s systematic approach allows you to anticipate potential failures whether they are in the design or manufacturing phase of a product. The overall process of FMEA has two broad categories: Design FMEA (DFMEA) and Process FMEA (PFMEA).
Within DFMEA and PFMEA, there are three categories. These categories have a scoring matrix that ranges from 1 to 10 to quantify the level of threat. They are as follows:
Severity: This category represents the level of risk to the end customer with 1 representing a low risk to the end customer and 10 designating a high risk to the end customer.
Occurrence: Here we show the probability of the risk event happening; 1 signifies a low likelihood of the risk occurring, whereas a 10 represents a very high possibility of the risk occurring.
Detection: Finally, we score on whether or not the likelihood that a failure would be detected. As opposed to the previous scores, this is inversely proportional. A 1 here indicates a process that will likely detect a failure, versus a 10 suggesting that the process will probably not discover a failure.
Upon scoring each category’s risk, you multiply the three scores together (Severity * Occurrence * Detection). The resulting score is what is known as a Risk Priority Number (RPN). After this, you sort the RPNs in descending order and can then take action on the top risks to lower the overall risk.
Note: Generally speaking, you cannot lower the severity, so it is best to find ways to mitigate the occurrence or increase the detection. Upon completion of all actions, you can now recalculate the RPNs and determine new risks.
In summary, failures are errors or defects and can be either potential or actual. Whereas we define failure modes as the way(s) a device or process fails. Regarding failure effects, this describes the ways these failures can lead to defects, waste, or harmful outcomes. This includes device or process failures, bodily injury, or a reduction in product quality. These system failures can also affect other systems as well. So as you can see, effects analysis is a study of how failures impact various system components.
What Is FTA, and How Can it Limit the Risk of System Failures?
We consider FTA as taking a top-down approach to fault analysis. The primary purpose of the FTA is to assist in identifying potential causes of system failures before the failures can occur. It is also used for the evaluation of probable top events (system-level failures) through the use of statistical or analytical methods.
Scientifically speaking, FTA is a graphical tool that you can utilize to examine and explore the sources of system-level failures. FTA uses Boolean Logic to combine a series of lower-level events and its top-down approach to detect the component level failures (basic events) that cause the system level failure (top-event) to occur.
FTA consists of two elements: events and logic gates that connect the events to recognize the causes of the top events (system-level failures). In general, FTA is a more straightforward method than FMEA since it concentrates on all possible system failures of the undesirable top event. However, with FMEA, it analyzes to find all possible system failure modes regardless of their severity.
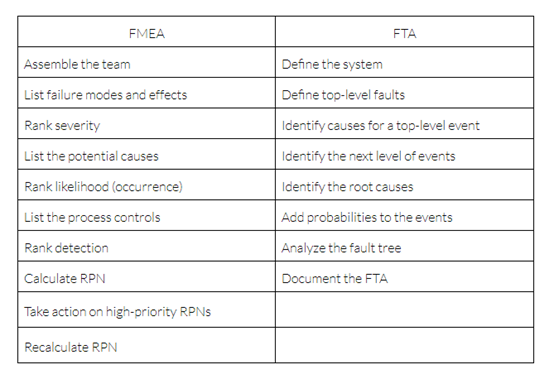
Comparing the Steps of the FMEA vs. FTA Processes
A side-by-side comparison of the steps of the FMEA process vs. the FTA process is a good way to see the method’s similarities and differences.
The use of FMEA and FTA both benefit a company throughout the design process, manufacturing process, and in-field use of their products. Overall, these two methods provide increased cost efficiency, reduction of waste, lowered downtime, improved quality, and improved designs. Although their methodologies differ, both offer tremendous advantages in terms of making a company’s products better.
If you’re looking to learn more about which of these processes best suits your company’s needs, or you want to learn more about pcb assembly, welcome to visit our website www.abp.net.cn or contact us via [email protected].
